What we have measured
Every good number sits beside how often SeedCadence AI was wrong. Every number comes from dishes it had never seen.
The test in one look
seeds off in every 100, on an average photo
This is how often the count is wrong.
in every 100 "sprouted" calls were right
6.3 in every 100 were wrong.
seeds in every 100 it asks you about
Of the ones it answers alone, 98.2 in every 100 are right.
How we tested
SeedCadence AI learned from 196 dishes and their 9,540 photos.
Its settings were chosen on 24 other dishes.
Every number on this page comes from 27 dishes it had never seen: 2,601 photos and 26,010 seed readings. They are the research team's own test dishes. Each photo is judged alone. It gets no help from earlier photos and nobody fixes anything. That is the hardest way to test it.
We put it beside the research team's own published score for their own model on the same test dishes, and beside a simple method with colour and shape rules and no learning. That is the thing to beat.
Research score is the measure the research team used. It rewards finding each seed and naming it right, from 0 to 100.
Maize, tested on dishes it had never seen
9 dishes, 873 photos, 8,730 seed readings.
Sprouted seeds, hour by hour
The solid line is what SeedCadence AI counted. The dashed line is what the research team's labels say. Under it, how far off the count was.
seeds off in every 100, on an average photo
Between 2.8 and 4.7 if the dishes were drawn again.
seeds off in every 100 on the worst photo
See the worst photo, hour 27.5
It counts a little too few. On average 1.6 seeds too few in every 100.
Right and wrong, in every 100
The solid bar is what the app got right. Red outlined bars are where it was wrong or fell short.
Against the research team and the simple method
On research score, SeedCadence AI scored 97.8 and the research team's own model scored 97.9. Ours is lower. The simple method scored 53.4. The average miss was 3.7 for SeedCadence AI and 20.8 for the simple method, so ours is closer.
Last count, dish by dish
The last count matched the labels exactly on 8 of 9 dishes. Solid bar: the app. Outlined bar: the labels.
Millet, tested on dishes it had never seen
9 dishes, 873 photos, 8,730 seed readings.
Sprouted seeds, hour by hour
The solid line is what SeedCadence AI counted. The dashed line is what the research team's labels say. Under it, how far off the count was.
seeds off in every 100, on an average photo
Between 5.1 and 8.1 if the dishes were drawn again.
seeds off in every 100 on the worst photo
It counts a little too few. On average 2.2 seeds too few in every 100.
Right and wrong, in every 100
The solid bar is what the app got right. Red outlined bars are where it was wrong or fell short.
Against the research team and the simple method
On research score, SeedCadence AI scored 95.6 and the research team's own model scored 94.2. Ours is higher. The simple method scored 1.2. The average miss was 6.6 for SeedCadence AI and 42.2 for the simple method, so ours is closer.
Last count, dish by dish
The last count matched the labels exactly on 5 of 9 dishes. Solid bar: the app. Outlined bar: the labels.
Rye, tested on dishes it had never seen
9 dishes, 855 photos, 8,550 seed readings.
Sprouted seeds, hour by hour
The solid line is what SeedCadence AI counted. The dashed line is what the research team's labels say. Under it, how far off the count was.
seeds off in every 100, on an average photo
Between 7.3 and 9.9 if the dishes were drawn again.
seeds off in every 100 on the worst photo
It counts a little too few. On average 3 seeds too few in every 100.
Right and wrong, in every 100
The solid bar is what the app got right. Red outlined bars are where it was wrong or fell short.
Against the research team and the simple method
On research score, SeedCadence AI scored 95.5 and the research team's own model scored 94.2. Ours is higher. The simple method scored 14.1. The average miss was 8.6 for SeedCadence AI and 31.9 for the simple method, so ours is closer.
Last count, dish by dish
The last count matched the labels exactly on 5 of 9 dishes. Solid bar: the app. Outlined bar: the labels.
When it asks
How often it asks, and how right it is alone
Each point is a pair of levels. The filled point is the pair SeedCadence AI uses. The labels name the two levels, in every 100.
It says a seed has sprouted on its own only when it is 80 or more in every 100 sure.
It says a seed has not sprouted on its own only when it is 7 or less in every 100 sure. Anything between the two, it asks you.
These levels were chosen on the tuning dishes. With them it asks about 28 seeds in every 100, and 95.7 in every 100 of the rest are right.
What these numbers are for
These numbers are for photos like these: a fixed camera above a small dish on a dark cloth.
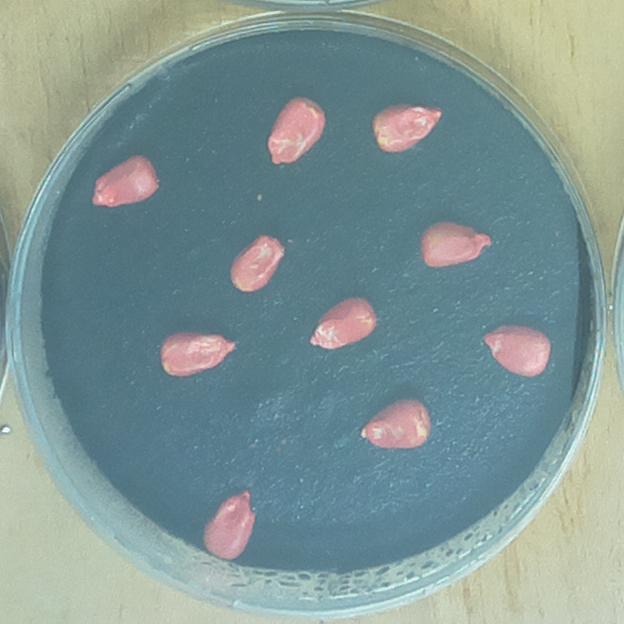
Photo from the germination dataset by Genze and Grimm (Mendeley Data, CC BY 4.0).
These trays come from a public research photo set. The people who made it are not SeedCadence customers and did not take part.